Plots below displays Child Maltreatment reports throughout the United States. Data is taken from the Children's Bureau. The data shows the number of reports of child victims per year per state.
Child Victim Ratio to State Population
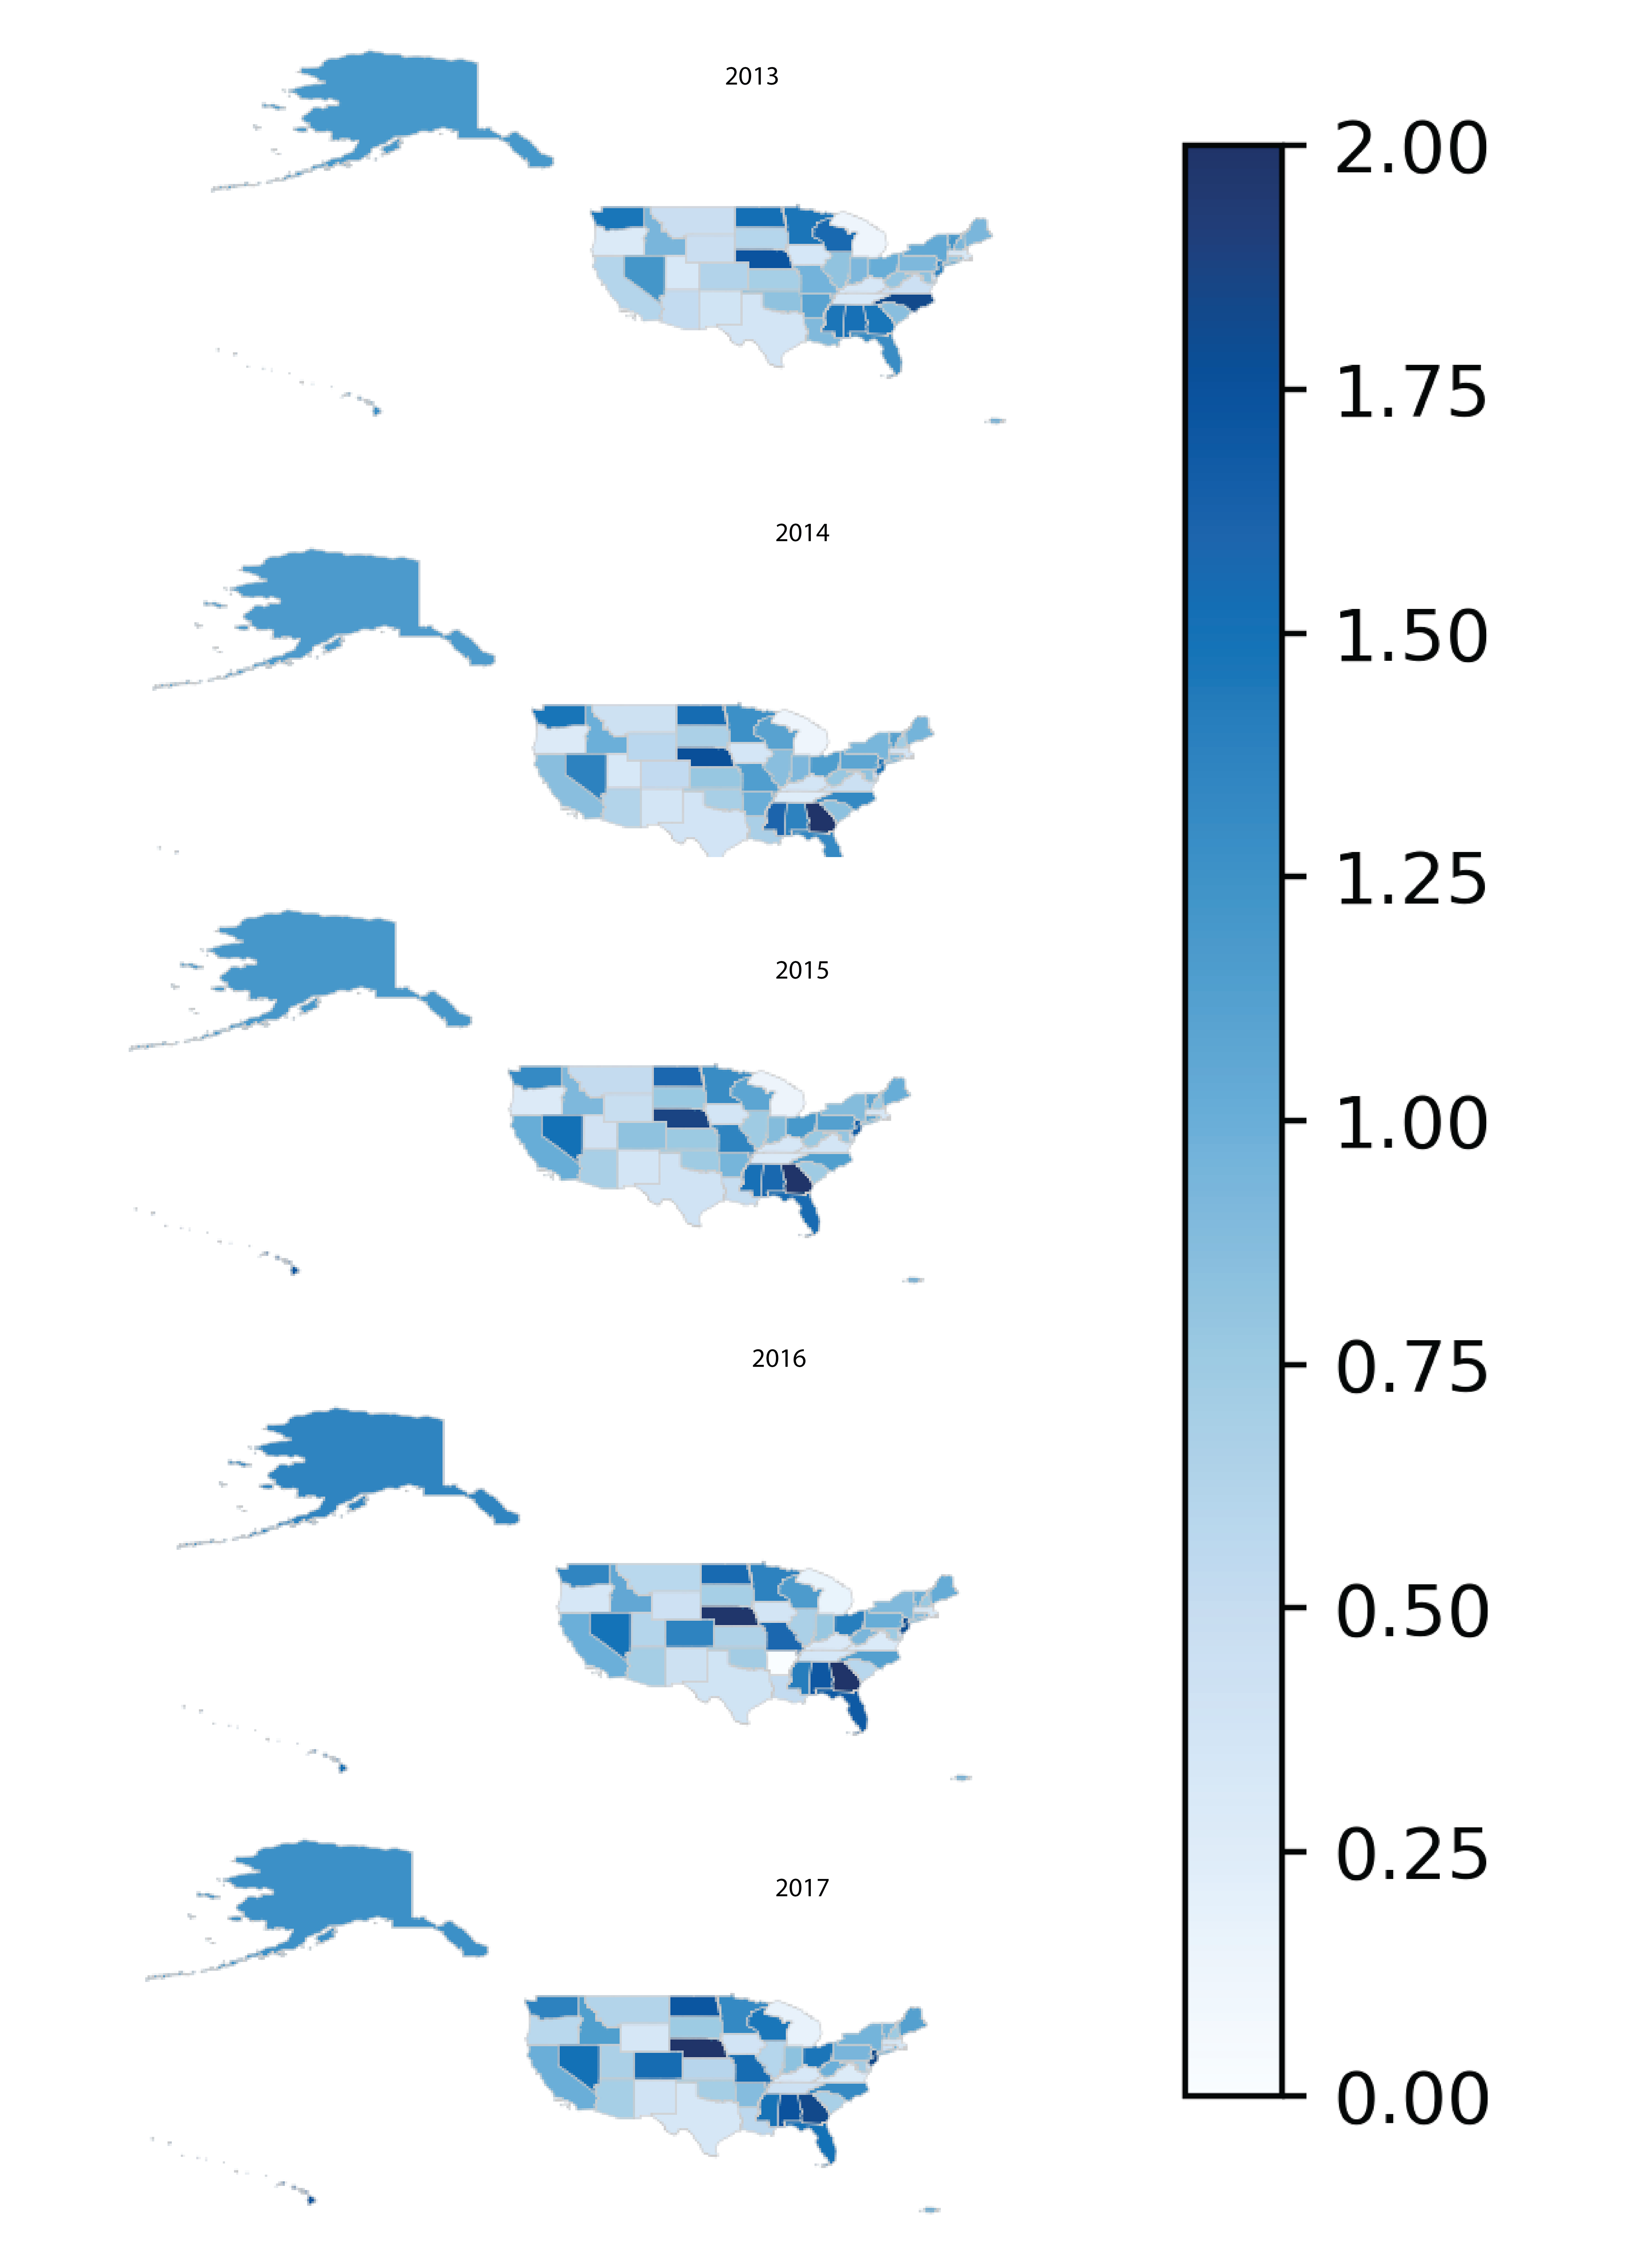
This is a colormap of the United States which shows the ratio of child victim reports. Ratio to the overall population of the state.
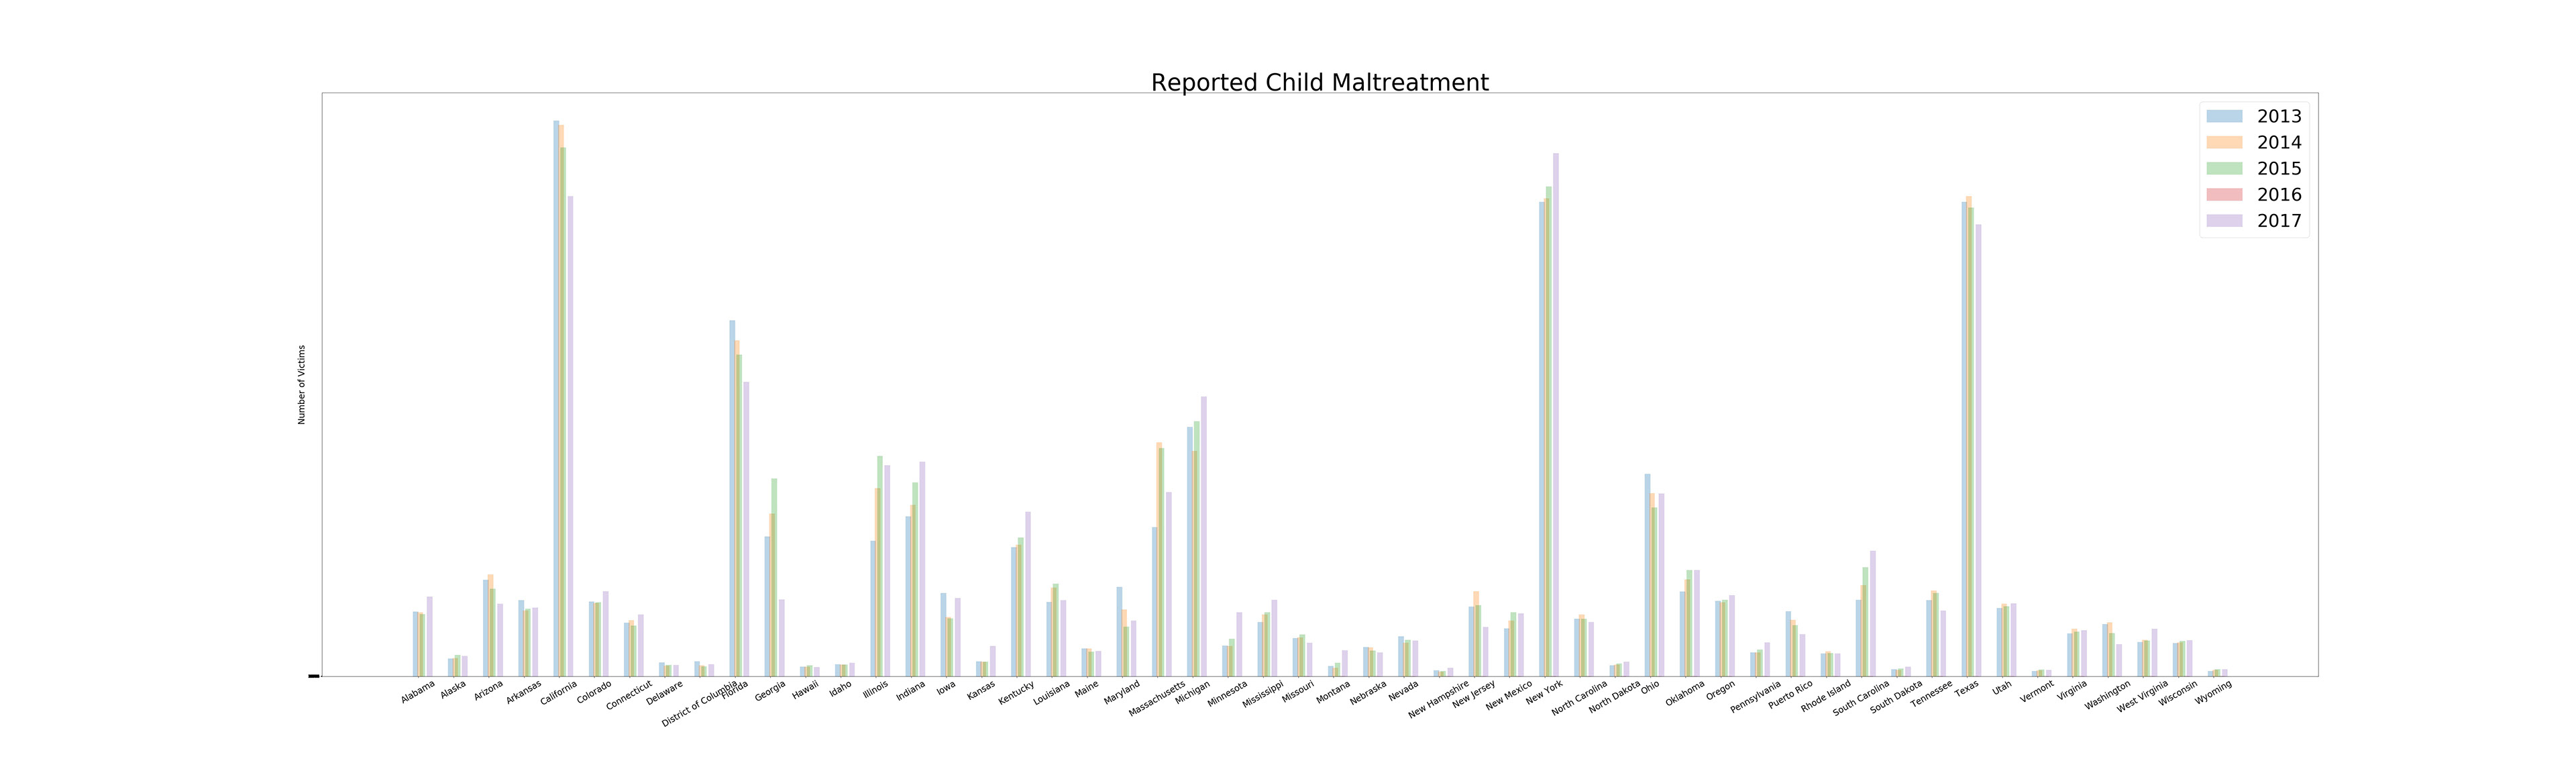
Bar graph of total reports of child maltreatments per year per state. The graph can show that each state does not have any significant changes from 2013-2017.
This data and further data collected will further give me evidence in creating my nonprofit for children. The information will be used as supporting evidence of children being mistreated even though there is no significant increase there is no significant decrease as well. In some states projected in the future years children maltreatment will increase. Further investigation would be used through US department of education information as well as other medias. I want to create a child friendly corpus that promotes mindfulness and inclusivity. So when responses to scenarios are used an alternative to the response would be given.